Automatic Counting of Trees in Drone Images
Counting trees may not exactly sound like interesting or lucrative business. Yet, with a global market size of 227 billion $ there are obviously many more people active in the forestry sector than anyone not belonging to the sector would initially assume.
Forestry plantations require tracking the development of its trees in order to identify health and growth problems in the trees and to project the optimal timing of a harvest and its monetary value.
Typically, this is done by analyzing various small samples throughout plantation and inferring from that the total volume of lumber. Analyzing here means: Count trees, measure thickness of the trees, and observe any anomalies.
In the project at hand, we were analyzing an area of a few hundred hectars of pines (pinus taeda) in the state of Santa Catarina in South Brazil.
The analysis, carried out by my cousin's company (SuperGeo Engenharia e Topografia) found each hectar to be worth around 6000$, after discounting costs for logging and transport. The analysis took a dozen men-days due to the size of the area.
However, this time we also used drone footage and applied Computer Vision and Image Recognition algorithms to do the counting for us. The potential saving in time and work is enormous with costs expected to be at most of 50% of the original approach, going possibly down to 80% for big projects.
The aim of this post is to give you an insight into where we currently stand in this endeavour.
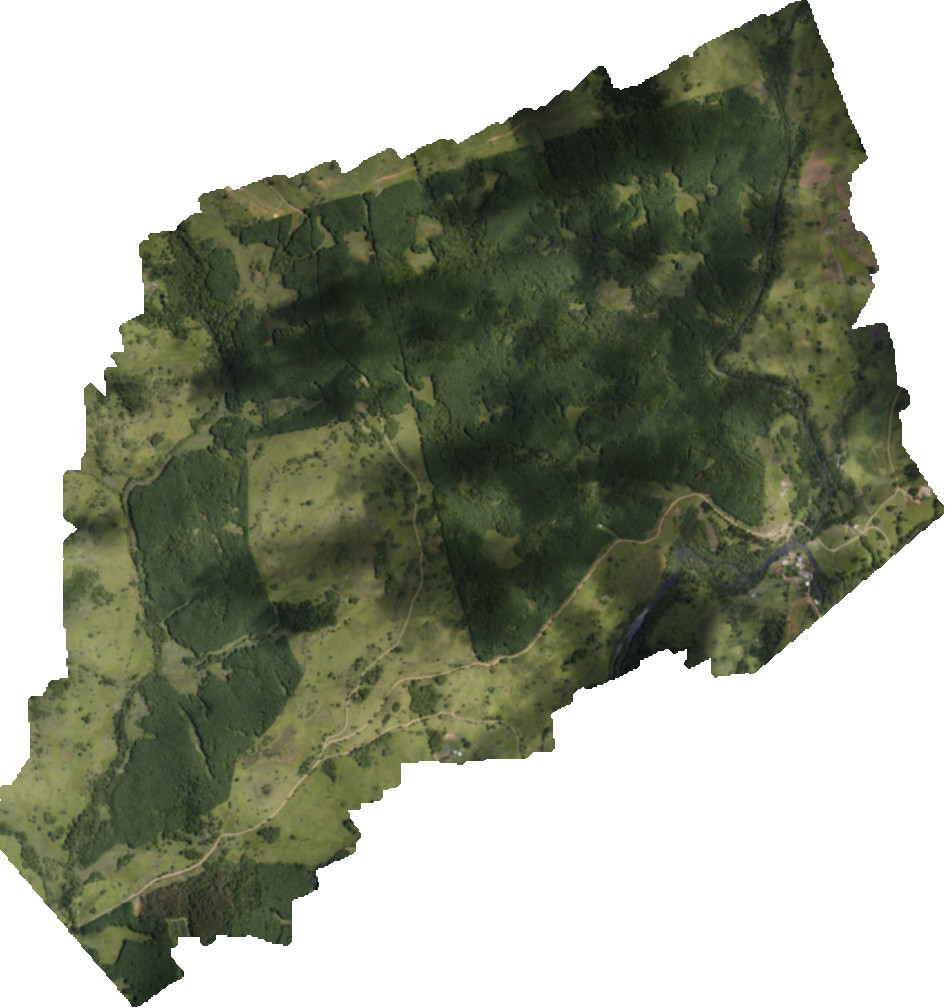
From Geo-Data to a Raw Image
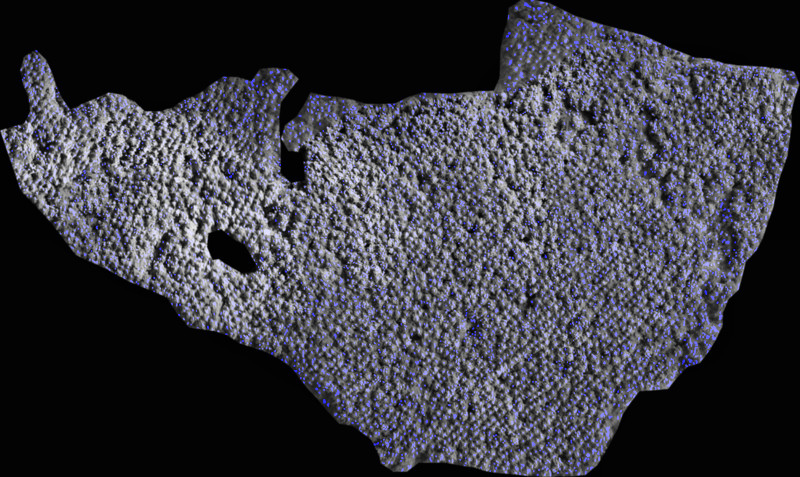
As inputs we received the Geo-Data of the area in question. So we went there and sent out a drone to take pictures of the area in question and weave those pictures together to one big raw image. The pictures taken by the drone camera had a resolution where each pixel is equivalent to an approximate area of 10x10 cm². f This means that a hectar translates to the size of a standard cell phone picture (1 million pixels) and an area of 3x3 kilometers (900 hectars) gives you a picture the size of a gigabyte. This image is big enough to take quite a few seconds to load on a modern computer and in this case already too big to be processed by my standard image viewing programs: For images bigger than 2GB my applications could not read the pictures anymore, I suppose that's because they don't expect (and were never tested with) "photos" of that size.
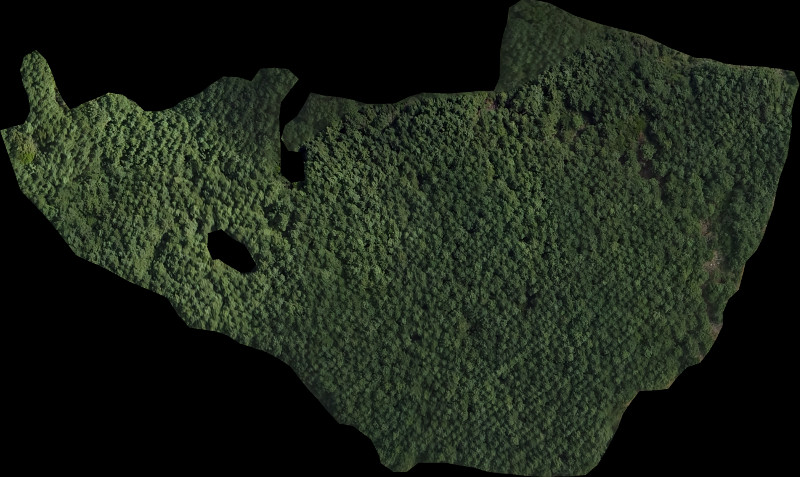
Breaking down the big picture
The Geo-Data represents a number of plots, that is, subareas where the tree planting and treatment would be similar across all trees of the plot. In the simplest case, each plot is a list of latitude-longitude pairs that form a ring. All trees within the ring belong to the same plot. So given such Geo-Data we transform each "ring of lat/long pairs" to image coordinates and extract, using GDAL Library, the corresponding subimage for each plot. In our big file there were 35 plots and plots area ranged from 0.1 to 25 hectars, or a hundred to some 50,000 trees. Image sizes ranged similarly from less than a megabyte to a few tens of megabytes.
An added difficulty is that each plot might have holes in it (due to rocks, lakes or houses, ...) or even consist of several unconnected pieces (due to roads, rivers, ...).
So, assuming a numbering for each plot from 1 to 35, we process each unconnected piece and assign it a character. With all subimages named like so: 1a, 2a, 2b, 3a, ..., we know that we have to analyze images 2a and 2b separately and then just aggregate the results (= tree counts) to obtain the result for plot 2.
Analyzing an image
This is where things get interesting: We have an image with three color channels and one transparency channel (red, green, blue, alpha) and we want to obtain the number of trees in the picture. We use the well-known OpenCV library for this and transform the image first to grayscale.
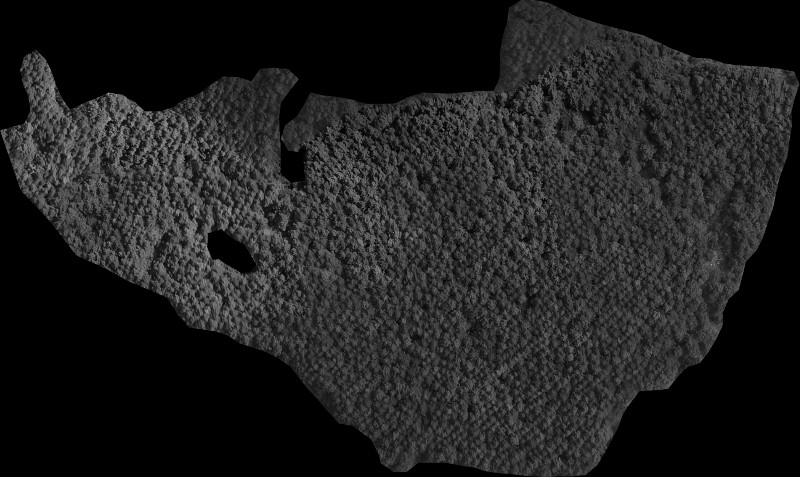
Since the whole area of interest is somehow grayish (from 100 to 200 on a scale of 0-255) we map the image color space to [0,255]. So now the darkest pixels have grayscale 0 (= black) and the brightest have grayscale 255 (= white).
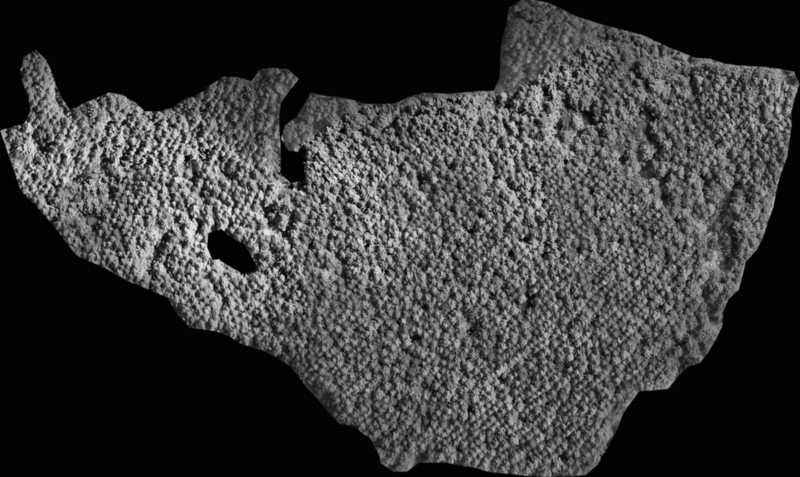
Then we first try counting the trees by using an algorithm that finds the brightest pixel relative to its neighbours, however, the result for an image with 6 thousand trees was some 30 thousand so that is obviously not the correct answer. The reason for this is noise: At the time the drone takes the big image, there might be dust particles or bird in the tree that affects the pixel brightness. We can remove that noise by smoothing out the image. This basically defines each pixel as the average of its own + its neighbours' pixel values. The problem here is of course that if we do this too much or too often, then our image becomes a grayish mass. Fortunately, since the tree canopies are up to 2m x 2m and the resolution is approx 10cm x 10cm, we can apply smoothing with a small kernel (which translates to a small neighbourhood of averaging the pixel values) without loosing track of the canopies or the dark regions between (= spaces between trees/canopies).
After smoothing we obtain a much better number that is already in the ball park of the number of trees. Still, it's generally too high (by approx 20%) so for each of the brightest pixels in the image we obtain the pixels around with slightly lower but approximately similar brightness. We can think of each of this as the pixel set that describes a tree canopy.
For each such pixel set we
- split it into two if it's too long or wide - two very close canopies were identified as one
- remove it if it's still just a single pixel - it can't be 10x10cm canopy so it must be noise
- remove it if it's too dark compared to the surroundings - sometimes there are "relatively bright" pixels between tree canopies
- remove it if it's at the edge of the area of interest - we keep the area of non-interest all black, so trivially there are a lof of relatively brightest pixels at the border.
To be continued...